Check a fund you own
Make your fund the benchmark. If dozens of similar funds beat it across most periods, it's worth asking why you hold it.
Try it with SCHDTutorial · about 12 minutes
Plenty of funds beat the S&P 500 for a while. Very few keep doing it. This tutorial explains why, how to tell a lucky streak from a durable edge, and how to weigh risk alongside return, using BetterThanSPY as a lab along the way.
Every number on this page comes from BetterThanSPY's data at the market close on October 21, 2026. Returns are total returns, with dividends reinvested. Click any Try it link to open the same view and explore it yourself; results there will reflect today's prices.
Every investment decision has a quiet alternative: you could have bought a low-cost S&P 500 index fund and done nothing. Most professional fund managers fail to beat that over long stretches, which is why the S&P 500 is the yardstick investors care about most.
So the useful question isn't "did this fund go up?" Almost everything goes up in a good market. The question is:
Did this do better than what I'd have owned by default, and did it keep doing so?
The gap between the two is the opportunity cost of a choice. A fund that returns 12% a year looks fine on its own, but if the index returned 15% over the same years, it cost you 3% a year, compounded.
Benchmark
The investment you compare against: your default alternative. SPY (an S&P 500 fund) is the usual choice, but it can be anything, including a fund you already own.
Opening BetterThanSPY runs a comparison straight away. The settings panel at the top is where you shape it:
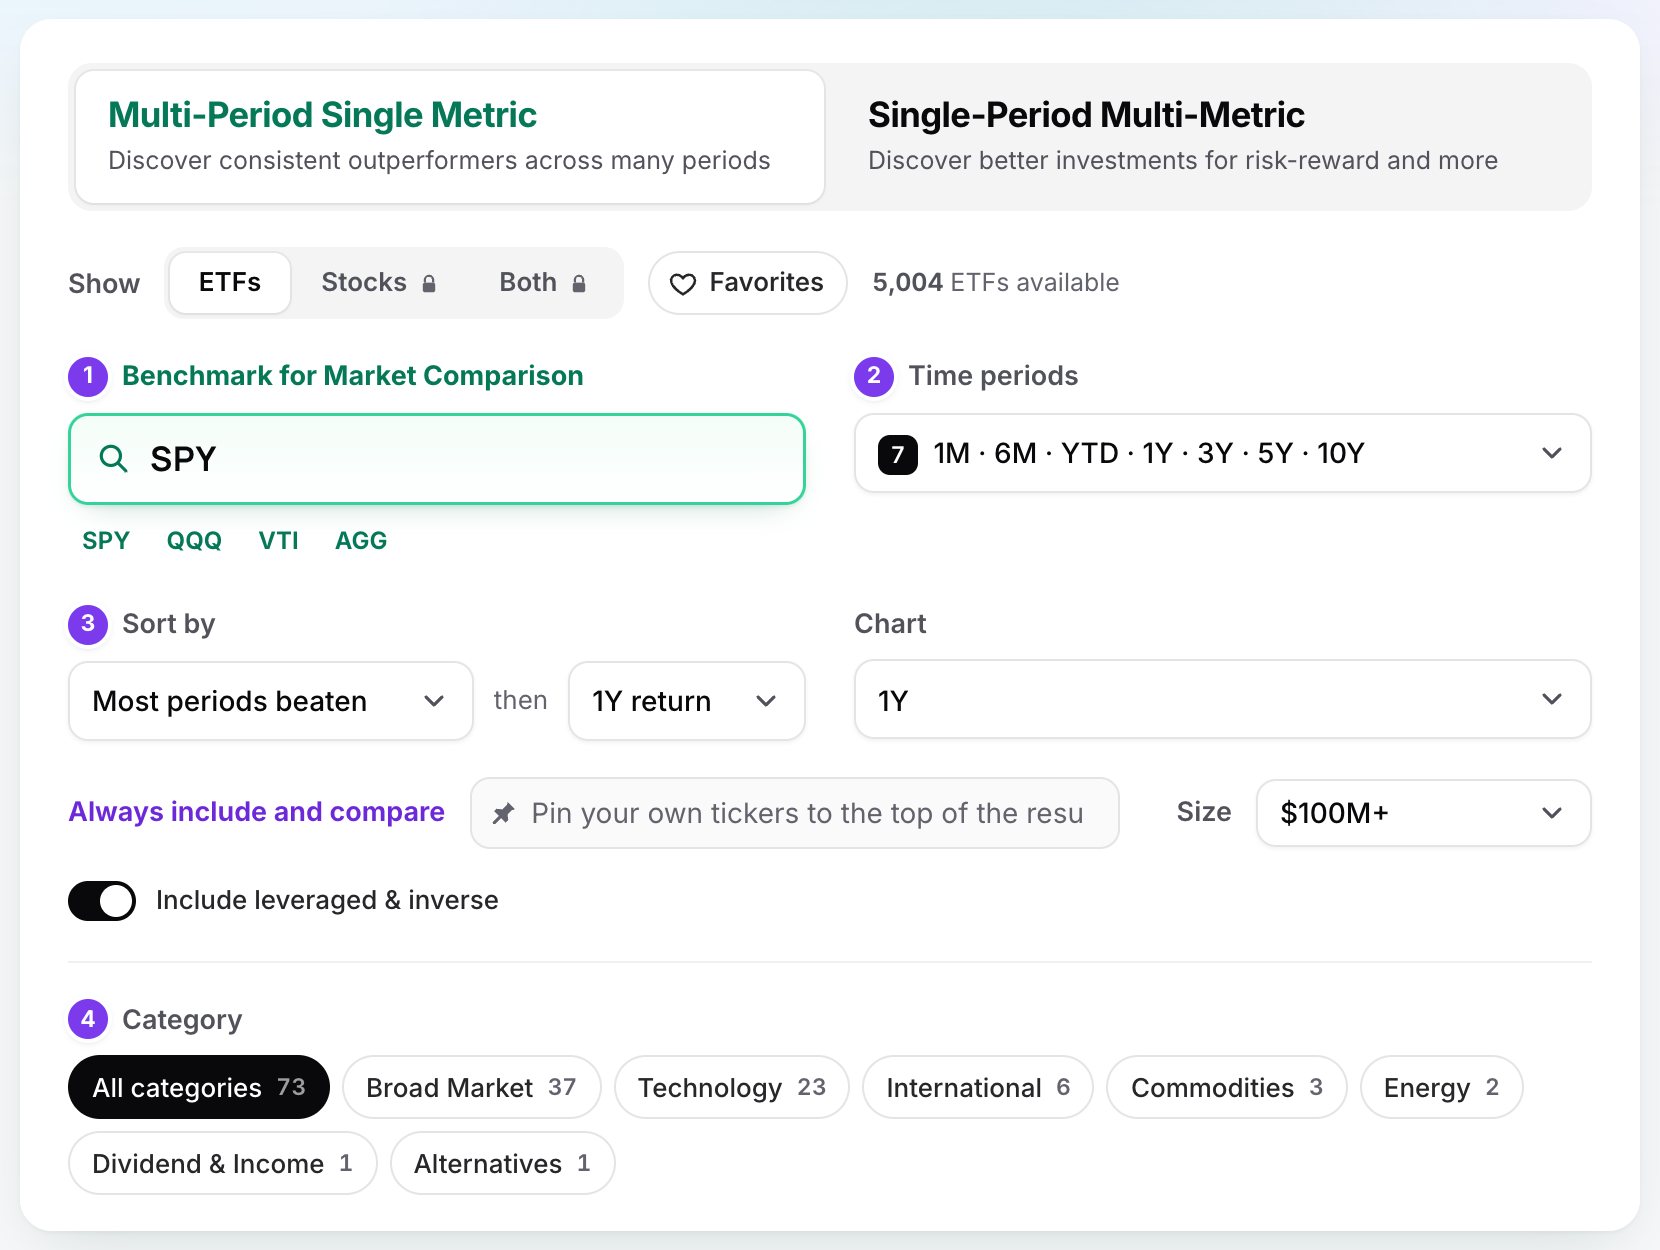
That's the whole idea: one scoreboard, every US ETF, scored on how often it beat your benchmark rather than how much it won in one lucky window.
Try it: the default comparison against SPYTake the 1,235 ETFs that have at least ten years of history and $100 million or more in assets. Here is how many beat SPY in each period on its own:
| Period | SPY's total return | ETFs that beat it |
|---|---|---|
| 1 month | −0.1% | 438 |
| 6 months | +10.4% | 209 |
| Year to date | +14.0% | 367 |
| 1 year | +16.4% | 444 |
| 3 years | +90.7% | 253 |
| 5 years | +82.2% | 230 |
| 10 years | +323.1% | 105 |
Out of 1,235 ETFs with 10+ years of history and $100M+ in assets.
Hundreds of funds beat SPY in any single window. Now ask for more than one window at a time:
Same 1,235 ETFs. Each step up removes roughly half of the field.
The drop-off is steep. Of the 444 funds that beat SPY over the last year, only 181 also beat it over five years, and just 68 over ten. Last year's winner is more often than not a long-run laggard.
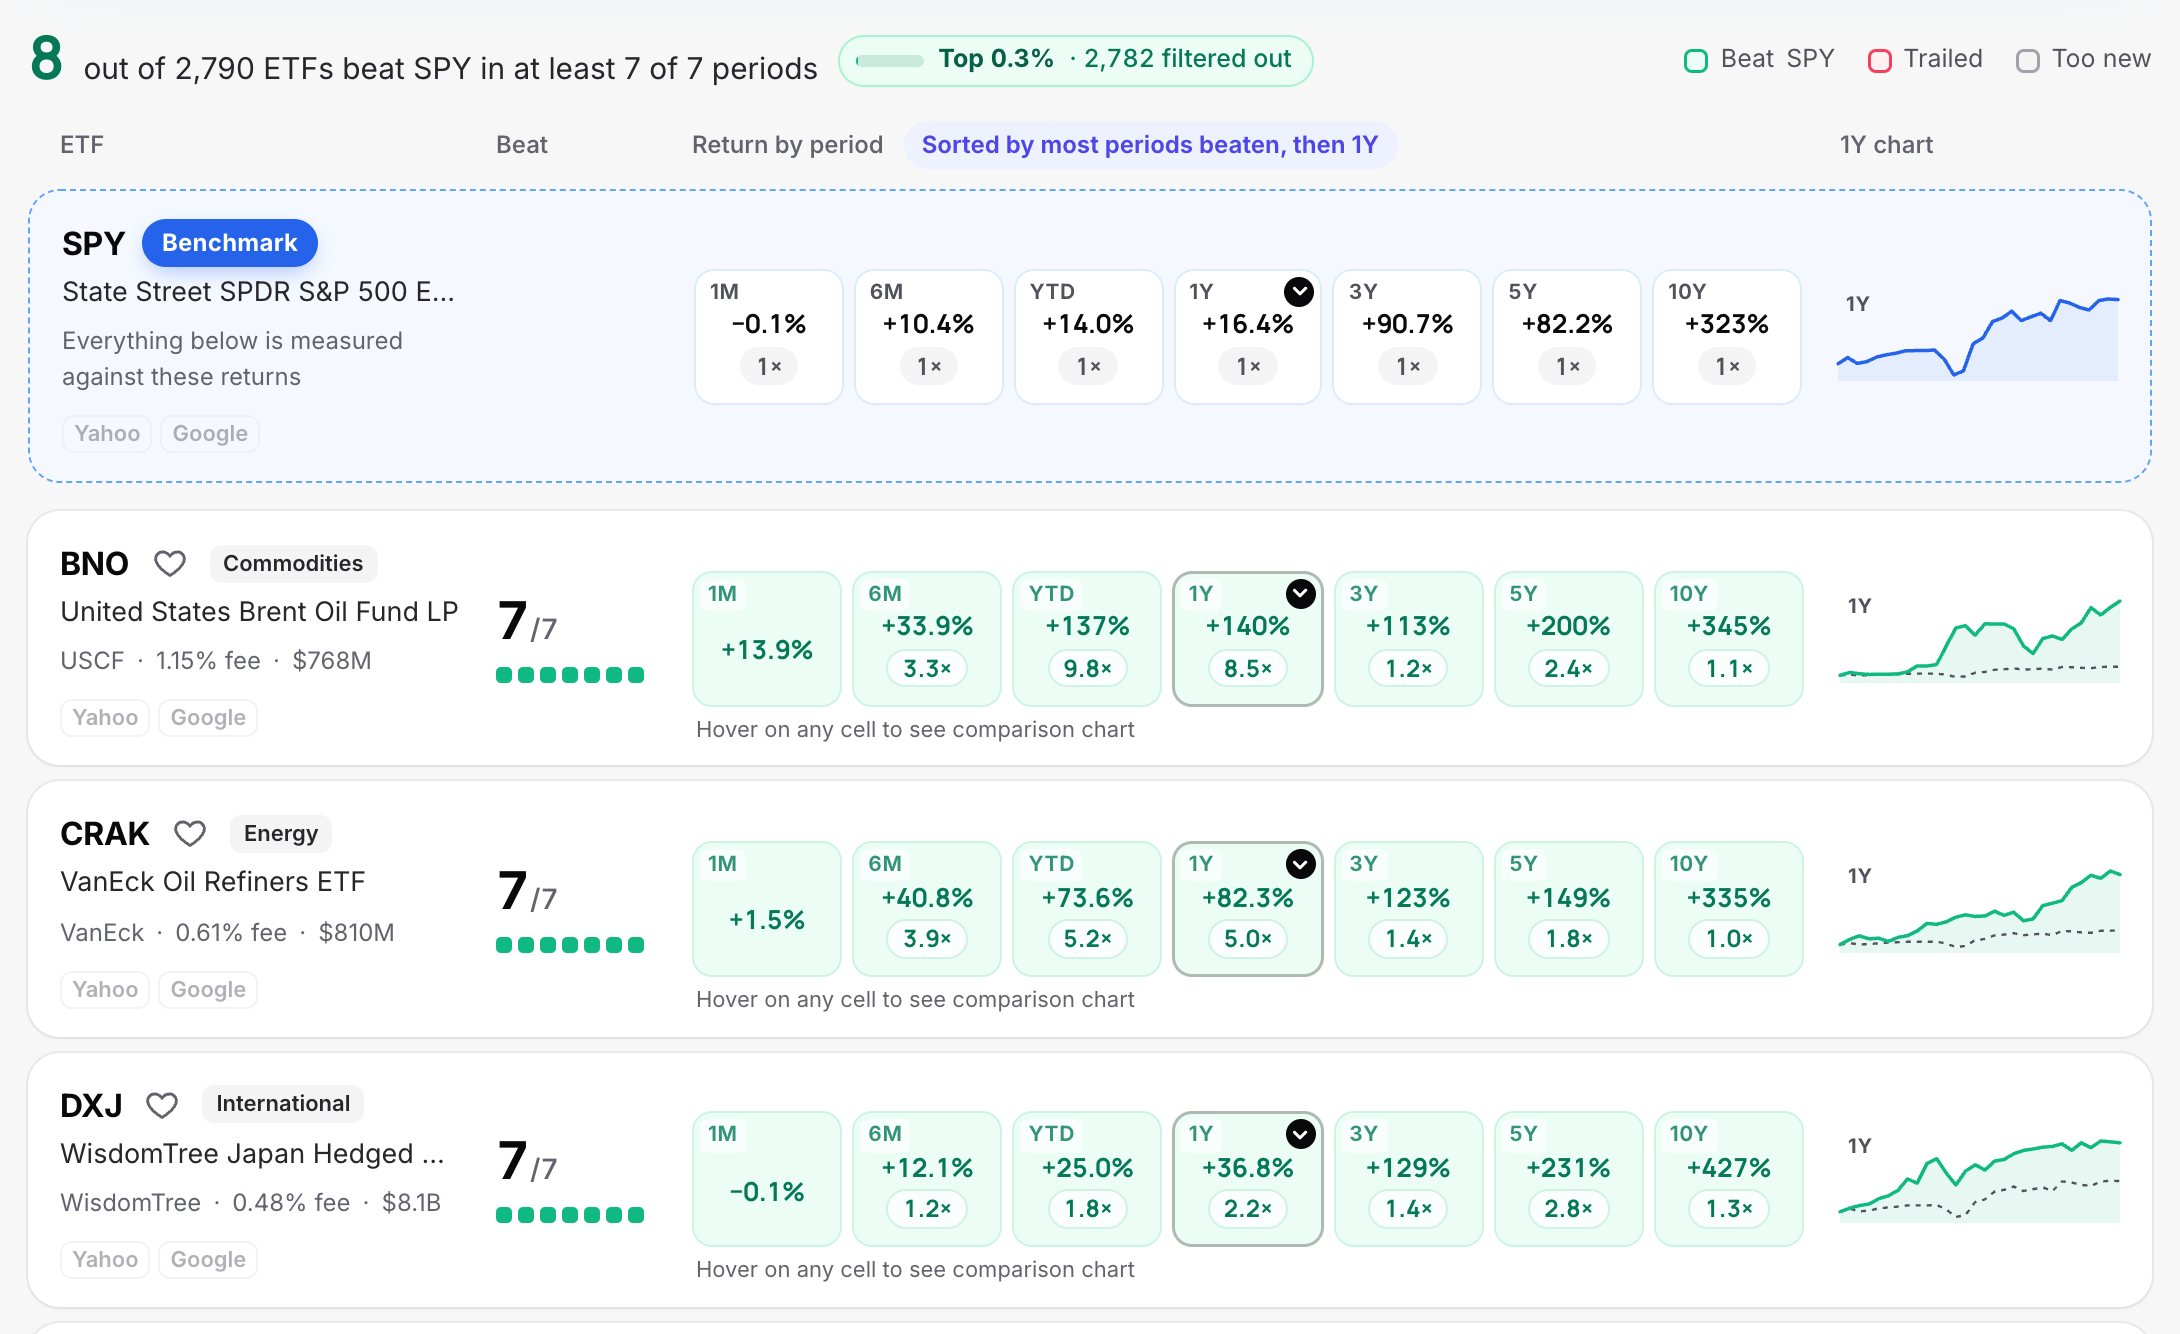
The eight funds that beat SPY in every period make the point well:
Key takeaways
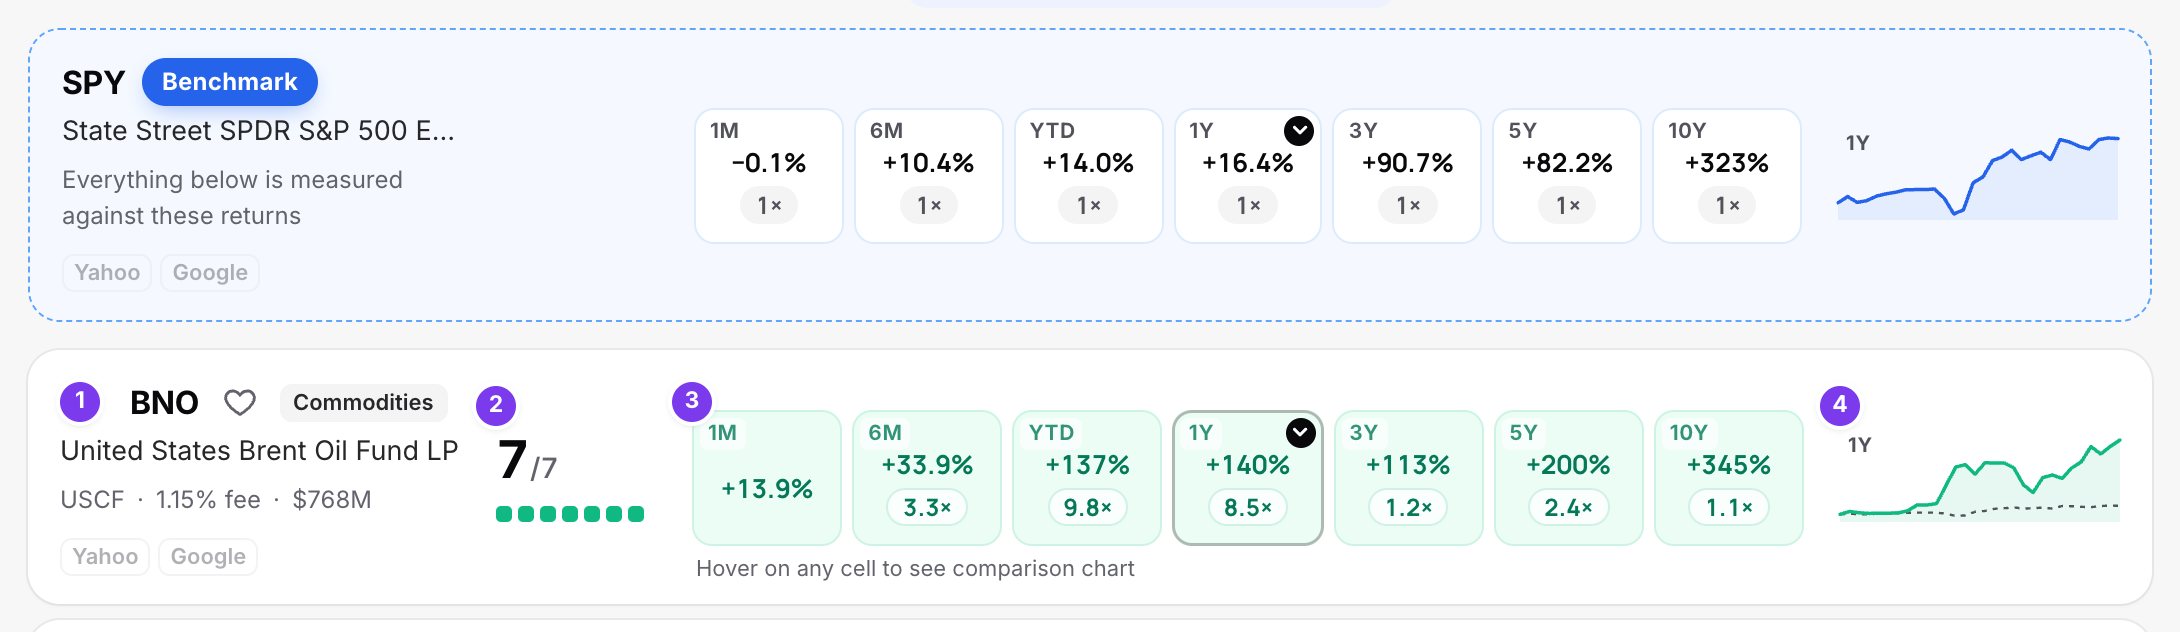
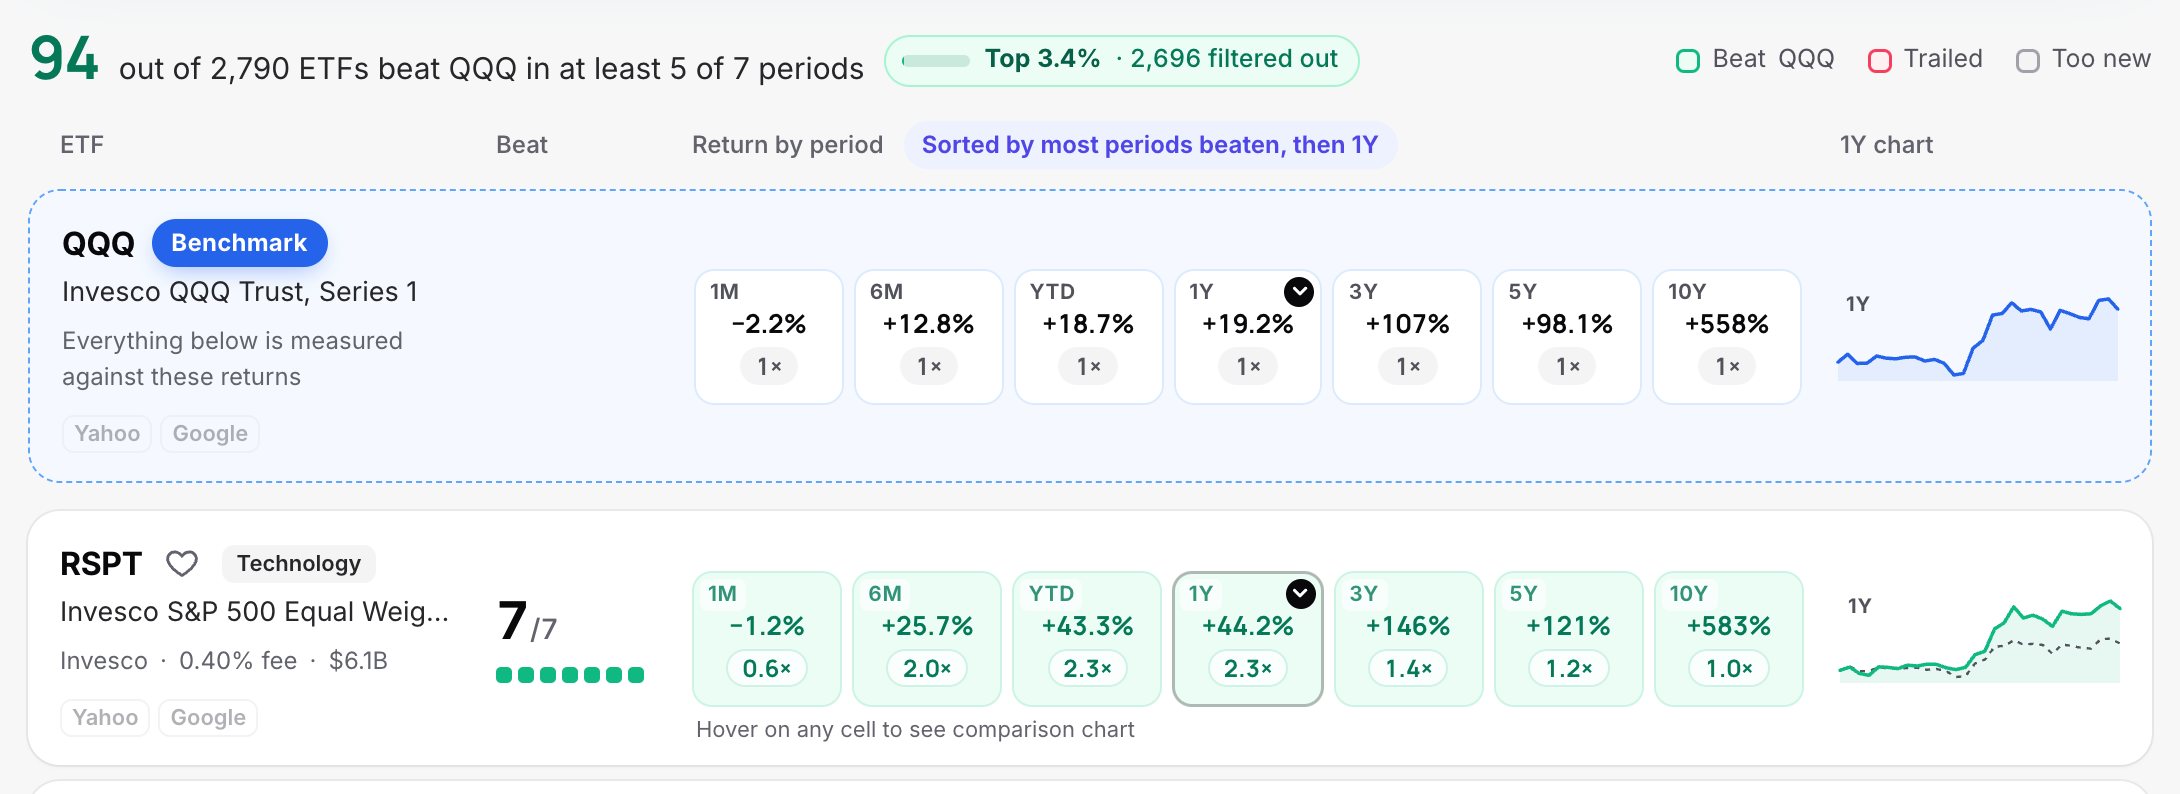
The benchmark sits at the top in blue, so you can always see the returns to beat. Below it, each result is one card, read left to right:
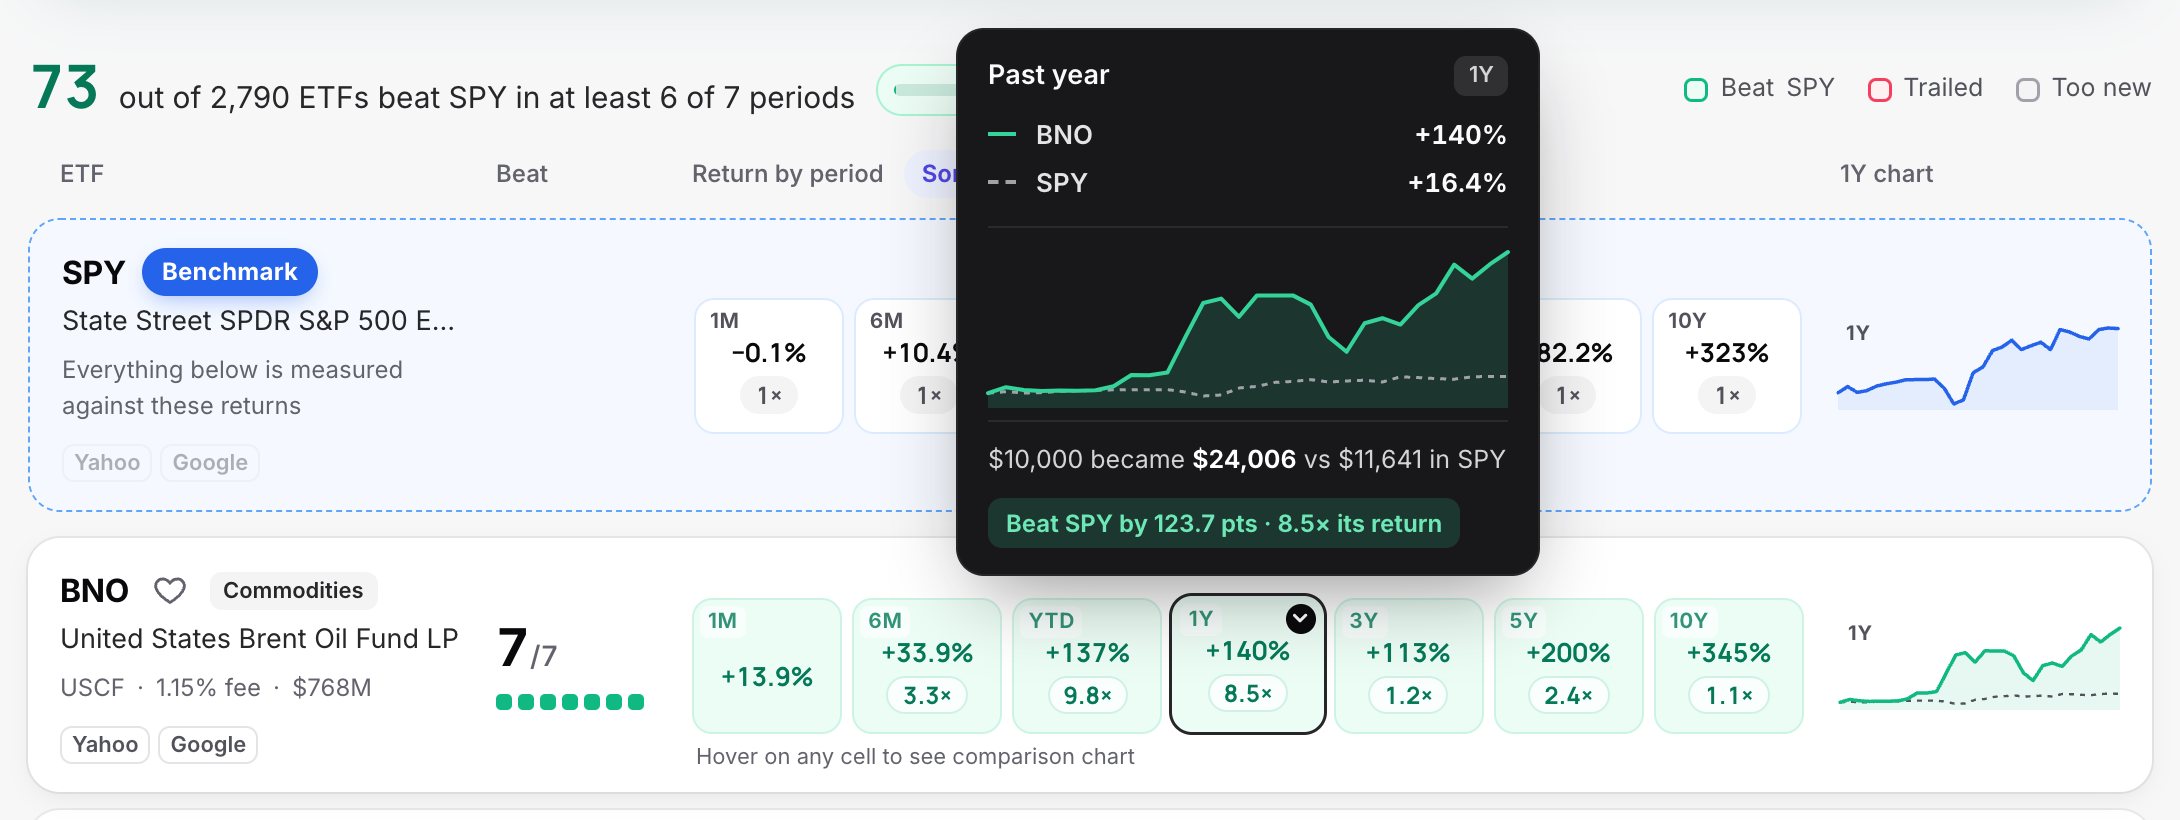
Hover over (or tap) any cell for a side-by-side chart and what $10,000 would have become in each:
A gray cell means the fund is too new for that period; it counts neither for nor against it.
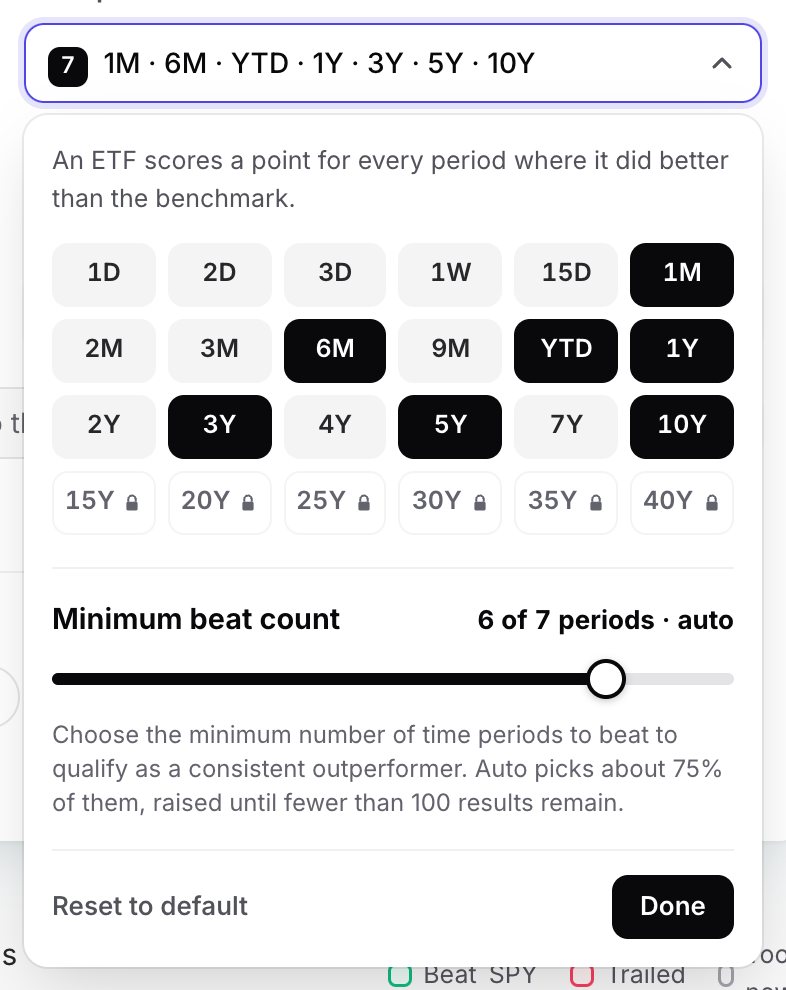
Mix short and long periods. Short ones (1 to 6 months) show what's working now, which is mostly momentum and theme. Long ones (5 to 10 years and beyond) show whether a strategy survives full market cycles. A fund that scores well across both is rare and worth a closer look.
The minimum score slider sits inside the period picker. By default it adjusts itself: it starts at about three quarters of your periods and rises until fewer than 100 results remain, so you always get a list short enough to study. Move it yourself whenever you want to be stricter or looser.
A comparison is only as good as its benchmark. The same five years tell very different stories depending on what you compare against:
| Benchmark | Its 5-year return | ETFs ($100M+) that beat it |
|---|---|---|
| QQQ · Nasdaq-100 | +98.1% | 191 |
| SPY · S&P 500 | +82.2% | 320 |
| VTI · total US market | +73.1% | 438 |
| AGG · US bonds | −1.3% | 1,605 |
Beating AGG during a stock rally says little: you're comparing stocks to bonds. Match the benchmark to the decision you're making:
These funds aim to deliver 2× or 3× (or the opposite) of an index's daily move. Over a day that works; over months, the daily resets make returns drift away from the index, usually downward in choppy markets. They dominate short-term leaderboards: 45 of the 50 best-performing ETFs over the last month were leveraged. Of the 183 leveraged funds with five years of history, 88 beat SPY last month, but only 40 did over five years.
If you're investing for the long run, switch off Include leveraged & inverse. The switch sits with the other filters, below the benchmark and periods:
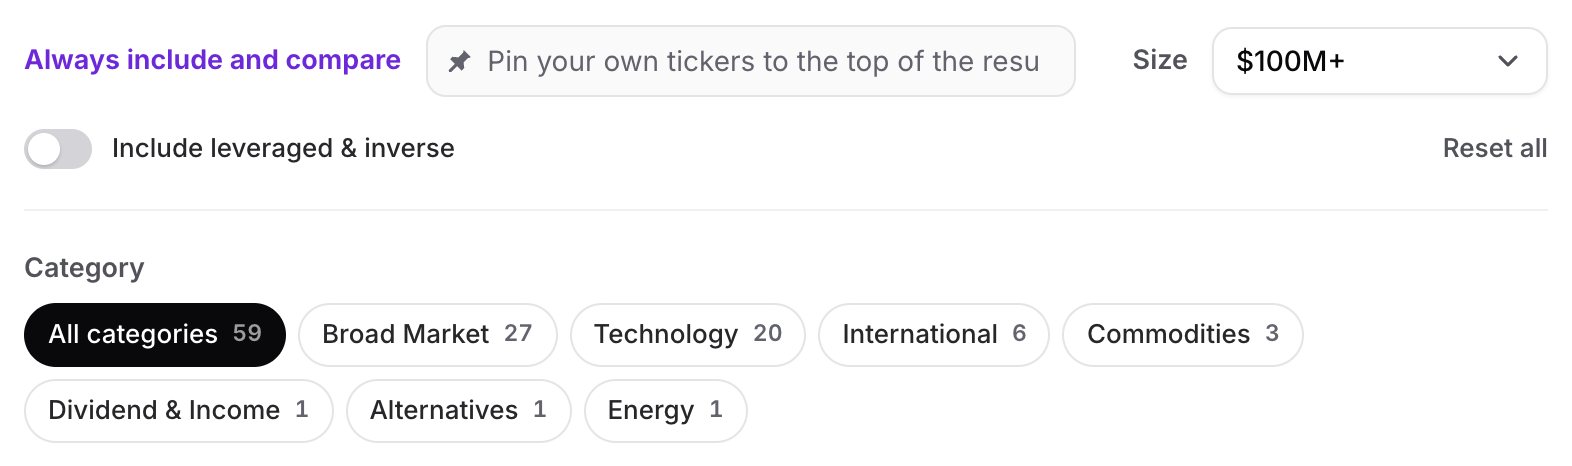
Small funds are more likely to close, can cost more to trade, and their short track records are easier to flatter. Of the 1,036 non-leveraged ETFs that beat SPY over the last year, 271 had under $100 million in assets. The default size filter ($100M+) keeps them out; lower it if you want to dig deeper.
Every card shows the expense ratio. Returns here are already after fees, but fees are the one part of future returns you know for certain, so between two similar funds the cheaper one starts ahead.
Category chips narrow results to a theme (Technology, Bonds, International and so on), which turns the scoreboard into an apples-to-apples ranking inside one corner of the market.
Two funds with the same return can be very different to own. One climbs steadily; the other swings wildly and falls 30% along the way. Most people sell during those falls, so the ride matters as much as the destination.
Here is how a few well-known funds compared with SPY over the last year:
| 1 year | Return | Volatility | Sharpe | Max drawdown | SPY corr | ATH trend |
|---|---|---|---|---|---|---|
| SPY · S&P 500 | +16.4% | 12.7% | 1.27 | −8.9% | 1.00 | 0.31 |
| QQQ · Nasdaq-100 | +19.2% | 19.9% | 0.99 | −12.0% | 0.93 | 0.16 |
| AVLV · US large-cap value | +30.6% | 11.8% | 2.32 | −6.4% | 0.81 | 0.56 |
| USMV · US minimum volatility | +9.7% | 8.6% | 1.12 | −6.5% | 0.50 | 0.60 |
| GLD · gold | +0.5% | 28.4% | 0.16 | −26.4% | 0.35 | 0.26 |
| AGG · US bonds | −2.0% | 4.0% | −0.49 | −4.6% | 0.44 | −0.06 |
Green: better than SPY on that metric. Red: worse. For volatility, drawdown and correlation, lower is better.
QQQ beat SPY on return, but with far bigger swings, so per unit of risk it did worse. AVLV beat SPY on every measure. USMV gave up return in exchange for a much calmer ride, which is exactly what it's designed to do.
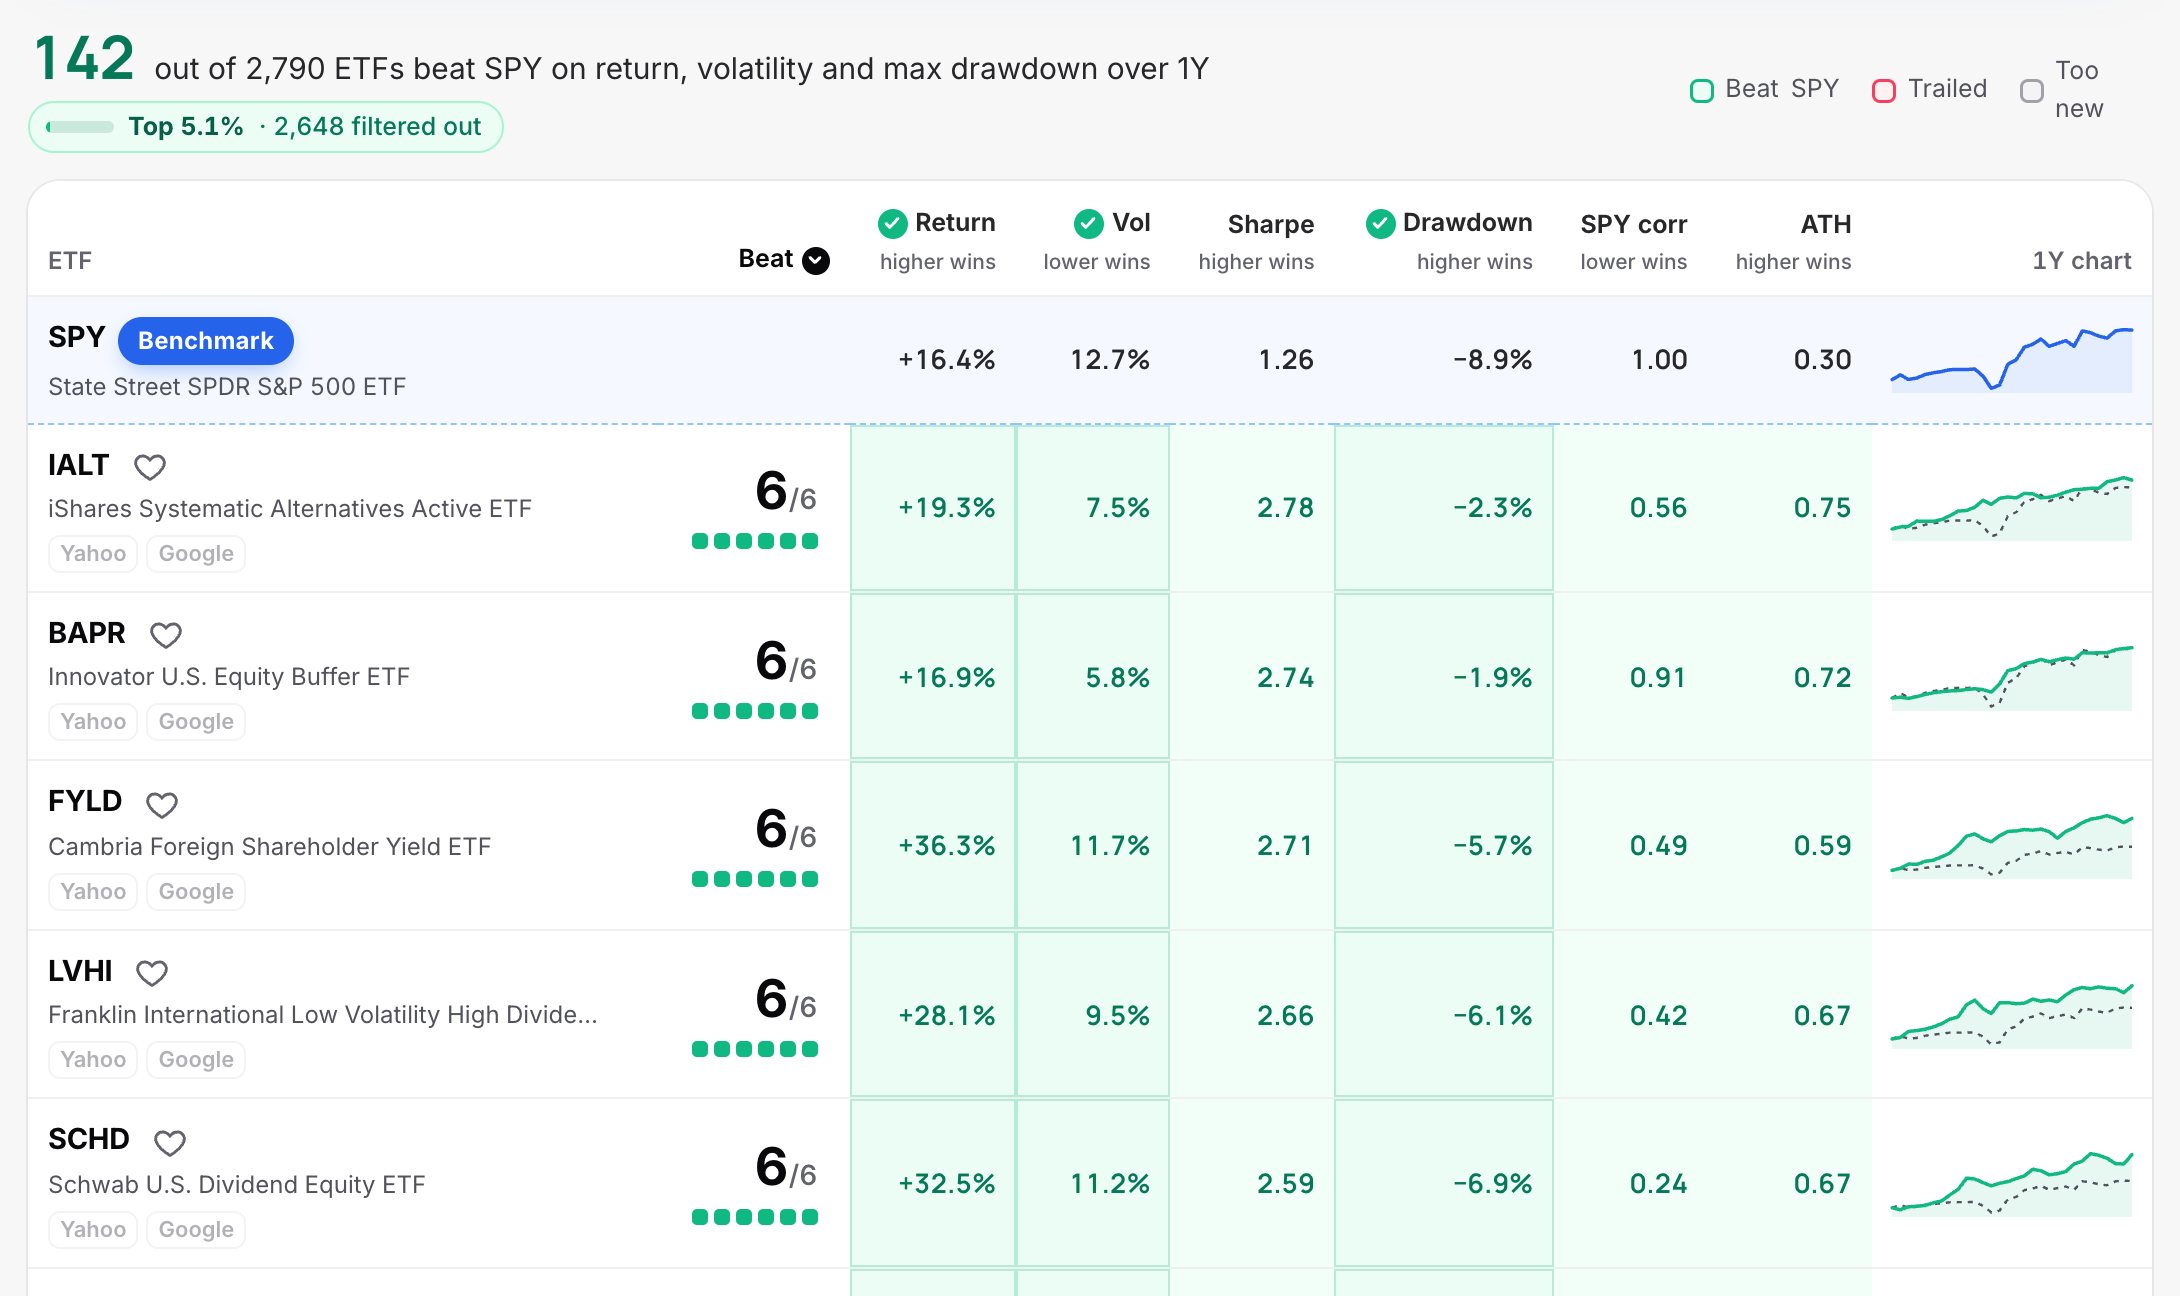
BetterThanSPY's Single-Period Multi-Metric tab Pro puts all six side by side for one period and lets you choose which ones a fund must beat. Pick the period, then tick the metrics under Must beat SPY on:
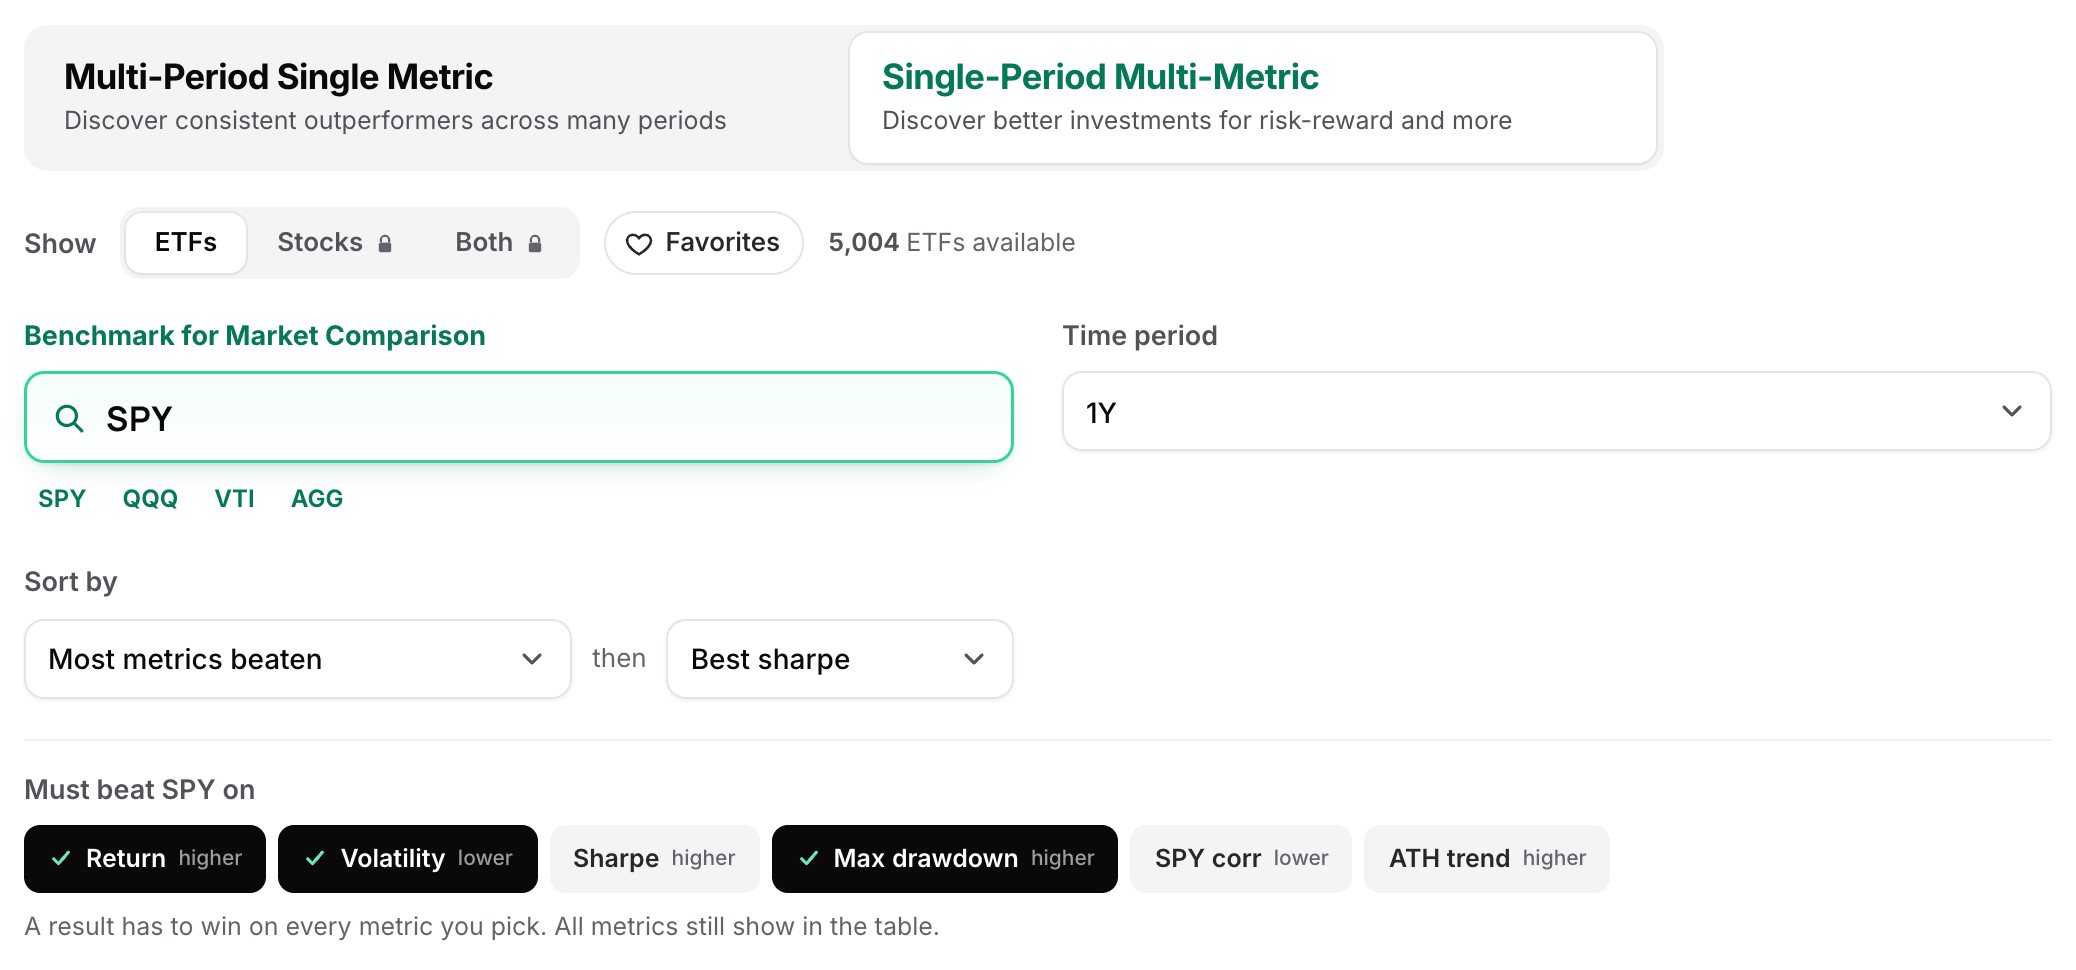
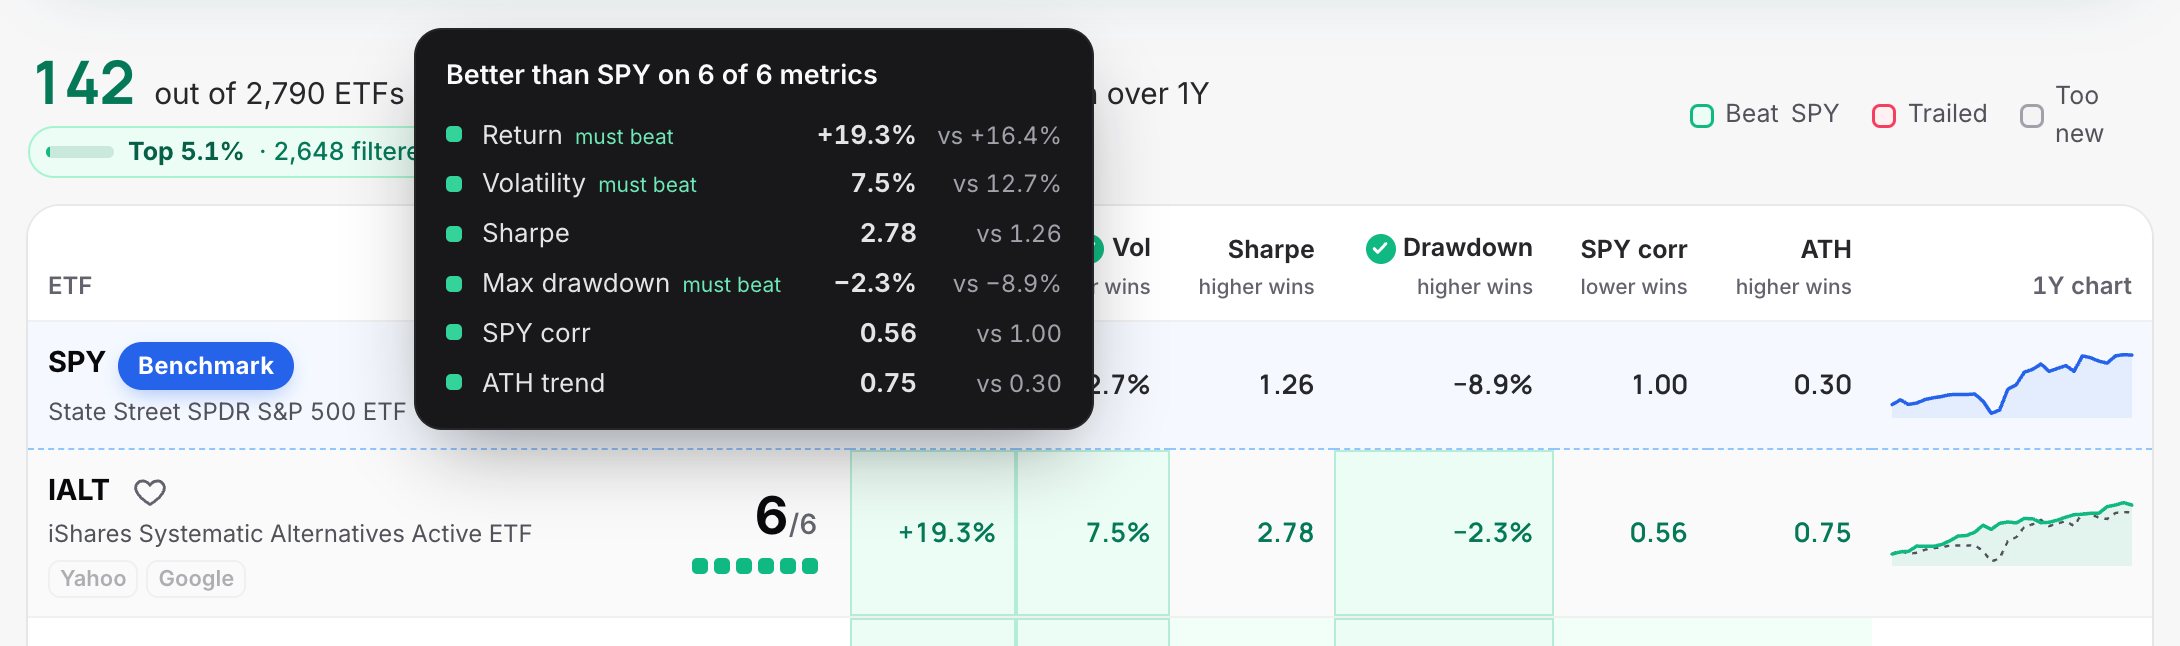
Every metric still shows in the table; the ticked columns carry a check mark, and green cells mark where a fund did better than SPY:
Hover over a score for the full breakdown, metric by metric:
Over the last year, among ETFs with $100M+:
Out of 2,796 ETFs with $100M+ in assets.
Four out of five funds that beat SPY's return did it by taking more risk. Asking for a higher return and a smoother ride cuts the list to the funds that genuinely did better, not just bolder.
Try it: higher return, lower volatility and a smaller drawdown than SPYMake your fund the benchmark. If dozens of similar funds beat it across most periods, it's worth asking why you hold it.
Try it with SCHDUse a popular fund as the benchmark and look for near-identical funds that beat it in every period. Often the difference is just the fee.
Try it against SPYLong periods only, all required, leveraged funds off. What's left has outlasted the index through full cycles.
Try itAsk for a lower volatility and a smaller drawdown than SPY over the last year, without giving up return.
Try itUse BetterThanSPY to narrow thousands of options to a short list worth researching, then do the research. Nothing here is investment advice.
Ready to explore? Everything in this tutorial is one click away.
Open BetterThanSPYWant to go deeper on risk, crashes and correlation? Read The Non-Math Quant Guide, our free book.